8/26/2024 Karolina Szafrańska

4/15/2024 Grzegorz Wyrwas
The programming environment is a key element in the daily life of every developer. In the case of IntelliJ IDEA, we can significantly increase the level of efficiency by using a variety of plugins and advanced debugging features. In this article, we will take a closer look at several tools that not only facilitate code writing but also increase testing efficiency and debugging precision. Let’s discover how to leverage the full potential of IntelliJ IDEA to become an even more productive software engineer.
IntelliJ Plugins
1. Developer Tools
It is a modern plugin, created with developers in mind, delivers a suite of tools that enhance efficiency and facilitate coding in the IntelliJ environment. With an icon by Gabriele Malaspina, the plugin offers a rich set of features, including encoding and decoding JWT, Base32, Base64, URL encoding, as well as generators for UUID, ULID, Nano ID, and passwords.
Additionally, tools for sorting, text transformation, diff preview, format conversion, color generation, QR/barcode codes, or Lorem Ipsum text make the plugin an indispensable support in a programmer’s daily work. Easily accessible as a tool window or dialog, the plugin also offers full integration with project settings in IntelliJ.
In short, it’s a versatile plugin that streamlines the coding process, text manipulation, and many other programming tasks, significantly increasing efficiency and comfort of work in the IntelliJ environment.
2. Inspection Lens
It is an innovative plugin that revolutionizes the programming experience by presenting errors, warnings, and other important inspection hints in a practical way. Once installed, inspection descriptions appear at the ends of code lines, while the lines themselves are highlighted with background coloration. The plugin offers a full spectrum of inspection significance, from errors and warnings to weak warnings, server problems, grammatical errors, typos, and inspections from plugins or future versions of IntelliJ with an appropriate level of significance. Each inspection category is assigned a unique color, taking into account both light and dark themes. It is worth noting that the plugin does not require complicated configuration, allowing only for disabling and enabling without the need to restart the development environment. For those looking for custom options, consider using the Inline Error plugin, which offers full customization, or creating your own version of Inspection Lens. This tool was inspired by Error Lens for VS Code and Inline Error for the IntelliJ platform. Introducing this plugin represents a breakthrough in detecting and dealing with errors during project work, undoubtedly increasing efficiency and coding quality.

3. Rainbow Brackets
Rainbow Brackets is an incredibly useful plugin for IntelliJ IDEA that adds colorful highlighting to brackets in the source code. When code contains many nested brackets, Rainbow Brackets assigns different colors to each nesting level of brackets, making it easy to identify corresponding brackets. This simple yet effective way of visually organizing code significantly eases a programmer’s work, enhancing readability and reducing the risk of bracket-related errors. Rainbow Brackets is a tool that not only facilitates daily work but also contributes to improving the quality and clarity of code during its creation and maintenance.
4. Key Promoter X
Key Promoter X is a tool that aids in learning the basic keyboard shortcuts while working. When you use a mouse to operate buttons in the development environment, Key Promoter X suggests which keyboard shortcut you should use instead. This simple solution facilitates the learning of replacing mouse work with keyboard shortcuts, speeding up the transition to faster and more efficient programming. The Key Promoter X tool window presents a list of the most frequently used mouse actions, simultaneously providing the corresponding keyboard shortcuts. For buttons without assigned shortcuts, Key Promoter X suggests the possibility of creating one.

Multiple Cursors in IntelliJ IDEA: Application Examples
Multiple cursors in IntelliJ IDEA is a tool that can greatly facilitate a programmer’s work, not only in code editing but also in various scenarios such as creating and modifying tests. Below you can find several examples of using this functionality, with an emphasis on testing in Spock.
1. Testing with Multiple Variants in Spock
When writing parameterized tests in Spock, where there is a need to test different variants, multiple cursors are helpful. For example, let’s check the test:
Multiple cursors allow editing values for different test cases simultaneously, significantly speeding up the process of creating or modifying different test variants.
2. Modifying Code in Multiple Places
Multiple cursors are equally useful when modifying code in multiple places simultaneously. For instance, when needing to modify the access level of fields within a class.
3. Exploring Additional Shortcuts and Strategies
The multiple cursors feature in IntelliJ IDEA is a powerful tool that greatly simplifies and accelerates code editing, offering the ability to make simultaneous changes in multiple parts of the code. While fully leveraging this feature may seem complex at first, it’s worth investing time to master the various keyboard shortcuts and techniques to significantly boost your productivity. Here are some of the key keyboard shortcuts related to the multiple cursors functionality in IntelliJ IDEA:
Alt + Shift + G (Ctrl + G on macOS): Adds another cursor to the next occurrence of the selected expression.
Ctrl + Alt + Shift + J (Ctrl + Cmd + G on macOS): Adds cursors to all occurrences of the selected expression throughout the document.
Shift + Alt + Arrows (Shift + Ctrl + Alt + Arrows on macOS): Enables the extension of selection in multiple places simultaneously, facilitating the addition of cursors vertically.
Alt + J (Ctrl + G on macOS): Adds another cursor to the next identical instance of text as the current selection.
Alt + Shift + J (Ctrl + Shift + G on macOS): Removes one of the multiple cursors, leaving the others active.
IntelliJ IDEA offers many more possibilities and shortcuts related to multiple cursors, which can dramatically increase your efficiency while working with code. Utilizing multiple cursors allows for quick changes in numerous places at once, particularly useful for refactoring code, editing variable names, methods, or even when creating repetitive code structures.
There are many possibilities that the multiple cursors feature offers, and presenting all aspects and techniques of utilizing this tool in a short guide would be challenging. Therefore, it is worthwhile to dive into the capabilities that this feature provides, explore various keyboard shortcuts, and seek ways to effectively use them in your daily programming work. I encourage you to experiment with different combinations and discover new, creative ways to apply multiple cursors in your projects, to fully utilize the potential that IntelliJ IDEA offers.
Advanced Debugging in IntelliJ IDEA: Practical Examples
1. Smart Step Into
Assuming we have the following code snippet, we want to go directly to the doJob method without stepping through getArg1 and getArg2. In this case, we use Smart Step Into (Shift + F7), which allows us to choose the target method without unnecessary entry into intermediate calls.
Smart step into can be default one, by setting:

2. Drop Frame
Let’s assume a situation where we’re debugging doJob and notice that the argument calculation has already occurred. We can use Drop Frame to go back to the previous method and process it again. This is especially useful in situations where we want to change something in the previous steps of debugging.
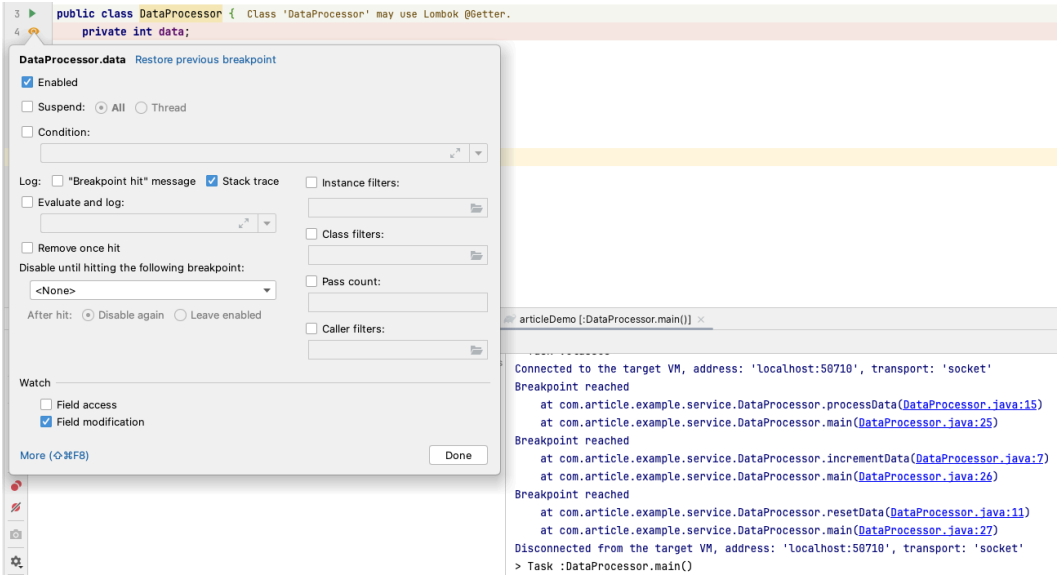
3. Field Breakpoints
We set a Field Breakpoint on the data field, which allows us to track when this field is modified during debugging. This is useful when we have multiple places in the code where this field is modified, and we want to track these changes.
4. Logging Breakpoints
Let’s consider the following code:
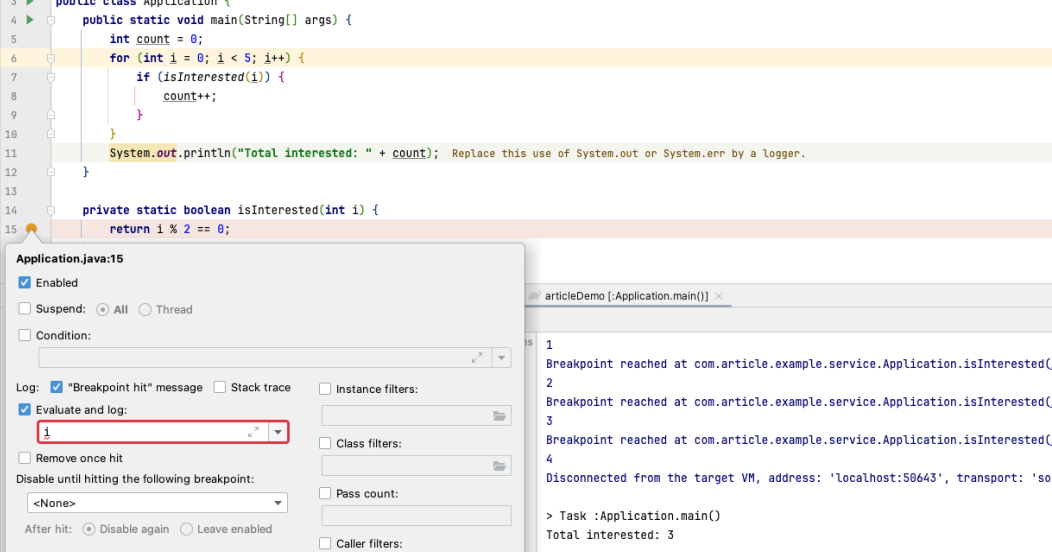
We want to see what values the arguments of the isInterested method calls have. We set a Logging Breakpoint on this method, which allows us to see logs in the debugger console, without stopping the execution of the program.
5. Object Marks
Assume we have a Task class nested within the Example class. Using Object Marks, we can assign labels to objects within the Task and monitor their state even after leaving the breakpoint.
These are just a few examples of utilizing advanced debugging features in IntelliJ IDEA. Mastering these tools allows developers to debug applications more precisely and efficiently.
Summary
IntelliJ IDEA is not just a code editor – it’s a comprehensive environment that supports the programming process. Utilizing advanced features and modern plugins can significantly ease not only daily work but also contribute to creating clearer and more efficient code. Discover the potential of IntelliJ IDEA and make programming even more satisfying and efficient.